This article will walk you through how to access PlayPosit analytics and grades, including how to leave feedback to individual responses and
Accessing Grading and Analytics in the Monitor page
- In CI Learn/Canvas, navigate to the PlayPosit assignment you wish to access.
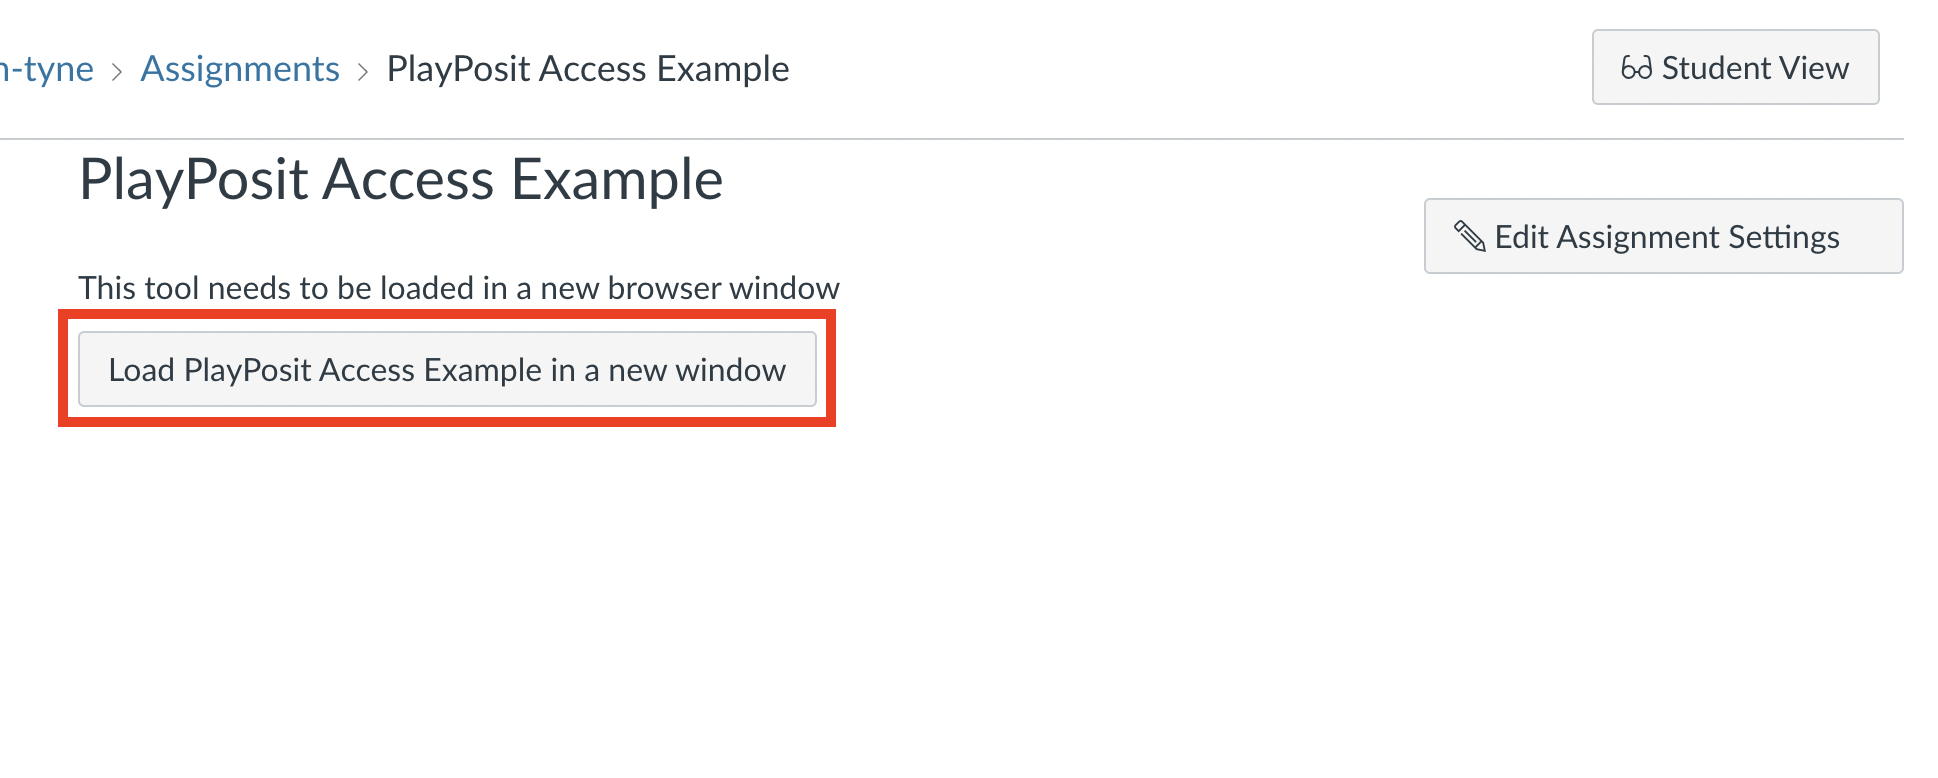
- Click the button to load the PlayPosit assignment in a new window. This will take you away from Canvas and open PlayPosit in a new tab.
- From the PlayPosit menu, select Monitor. This will take you to the bulb’s monitor page.

Navigating the Monitor page
The Monitor page is your launching pad for accessing analytics and grading. Explore below to see what is on each screen and what information you are able to access from it.
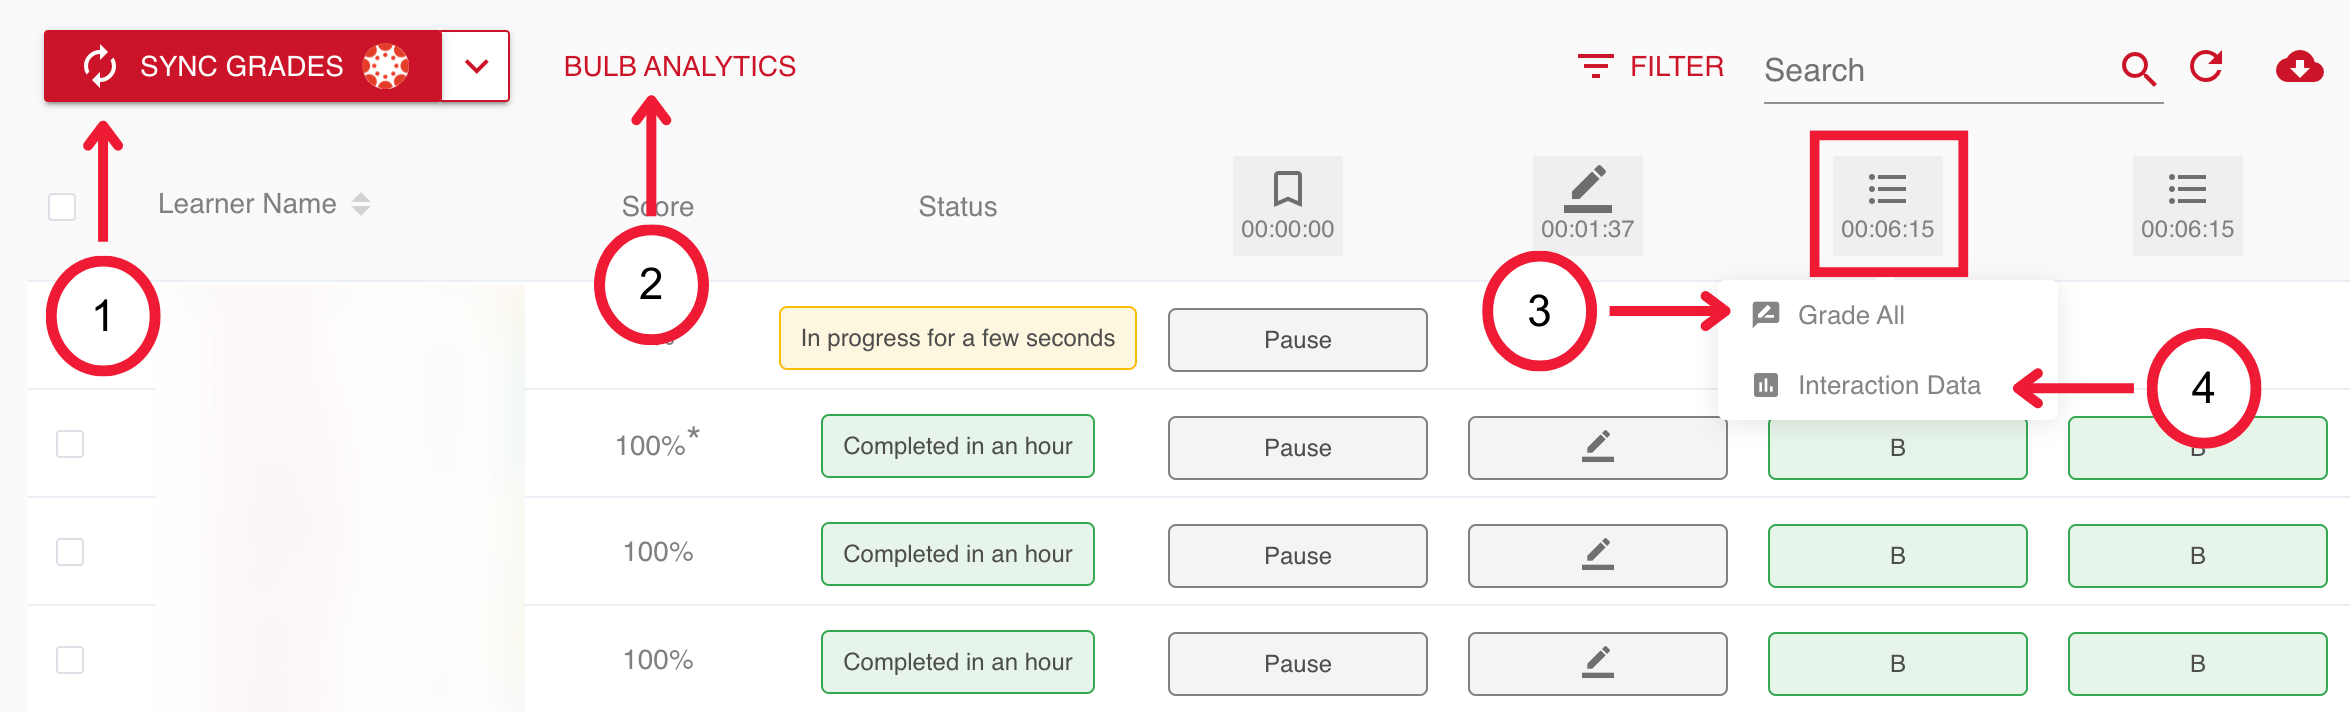
1. Sync Grades
When you are ready to send updated scores to the Canvas gradebook, click the Sync Grades button. This will update learner’s score with any recent grade changes.
2. Bulb Analytics
The Bulb Analytics page provides you with at-a-glance information on the progress of your students. This is useful for keeping tabs on your learners as well as easily identifying questions students are struggling with.
The Bulb Interaction Summary shows the fraction of learners that answered questions correctly or incorrectly. The Bulb Average Score shows you the grade distribution of your learners. The Bulb Completed Status shows the fraction of students that have completed the Bulb, are in-progress, or have not begun the Bulb. 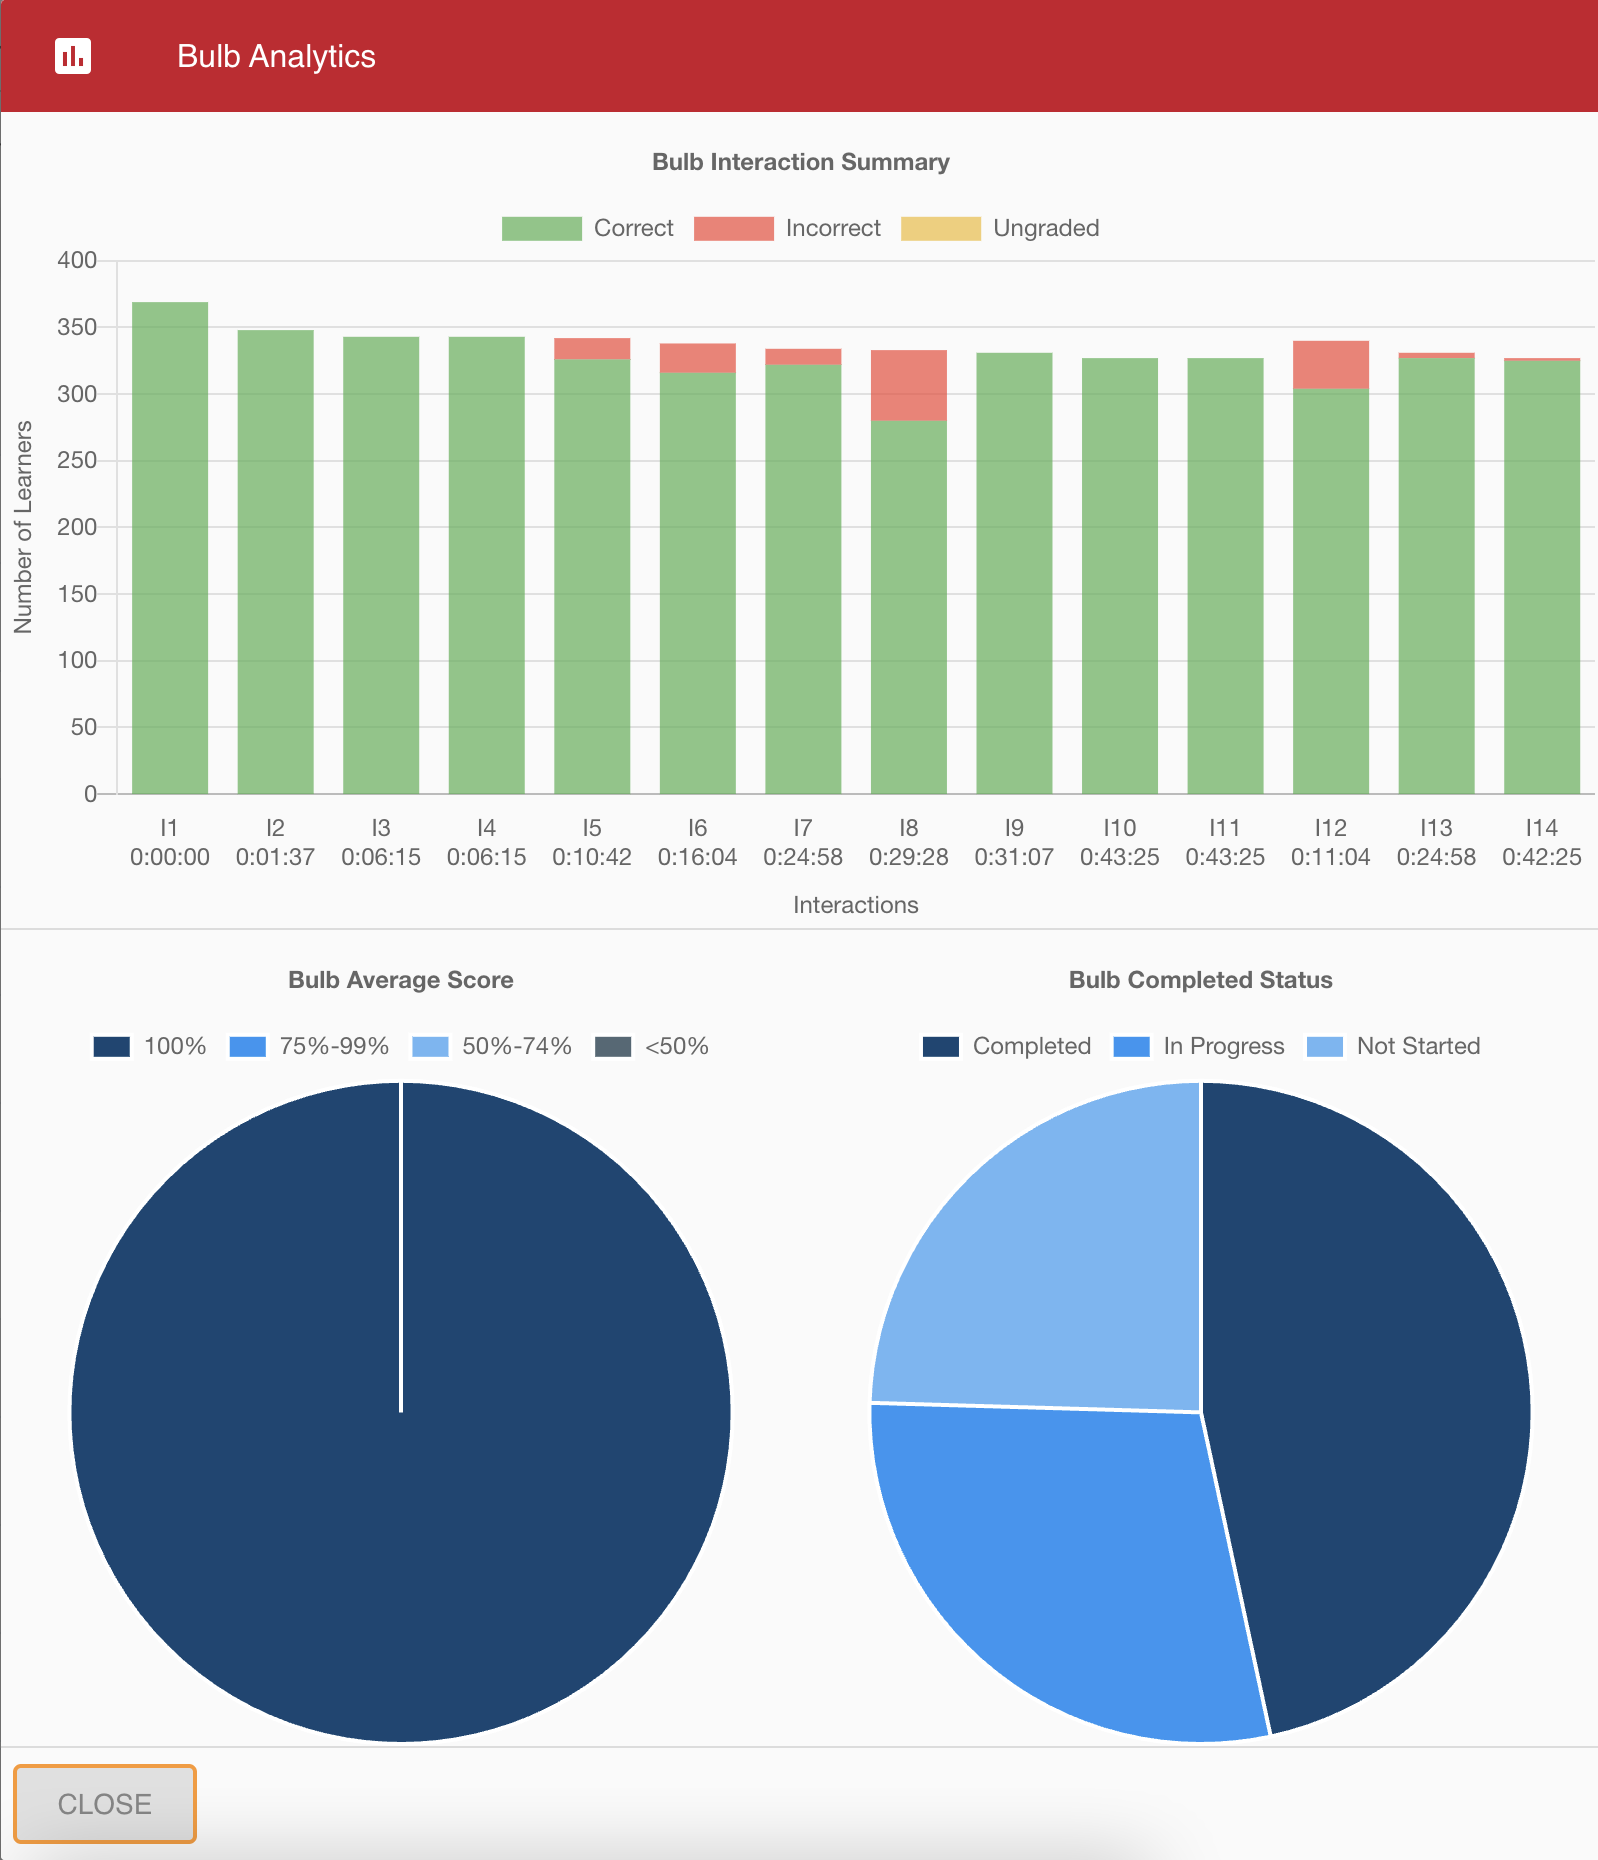
3. Grade All
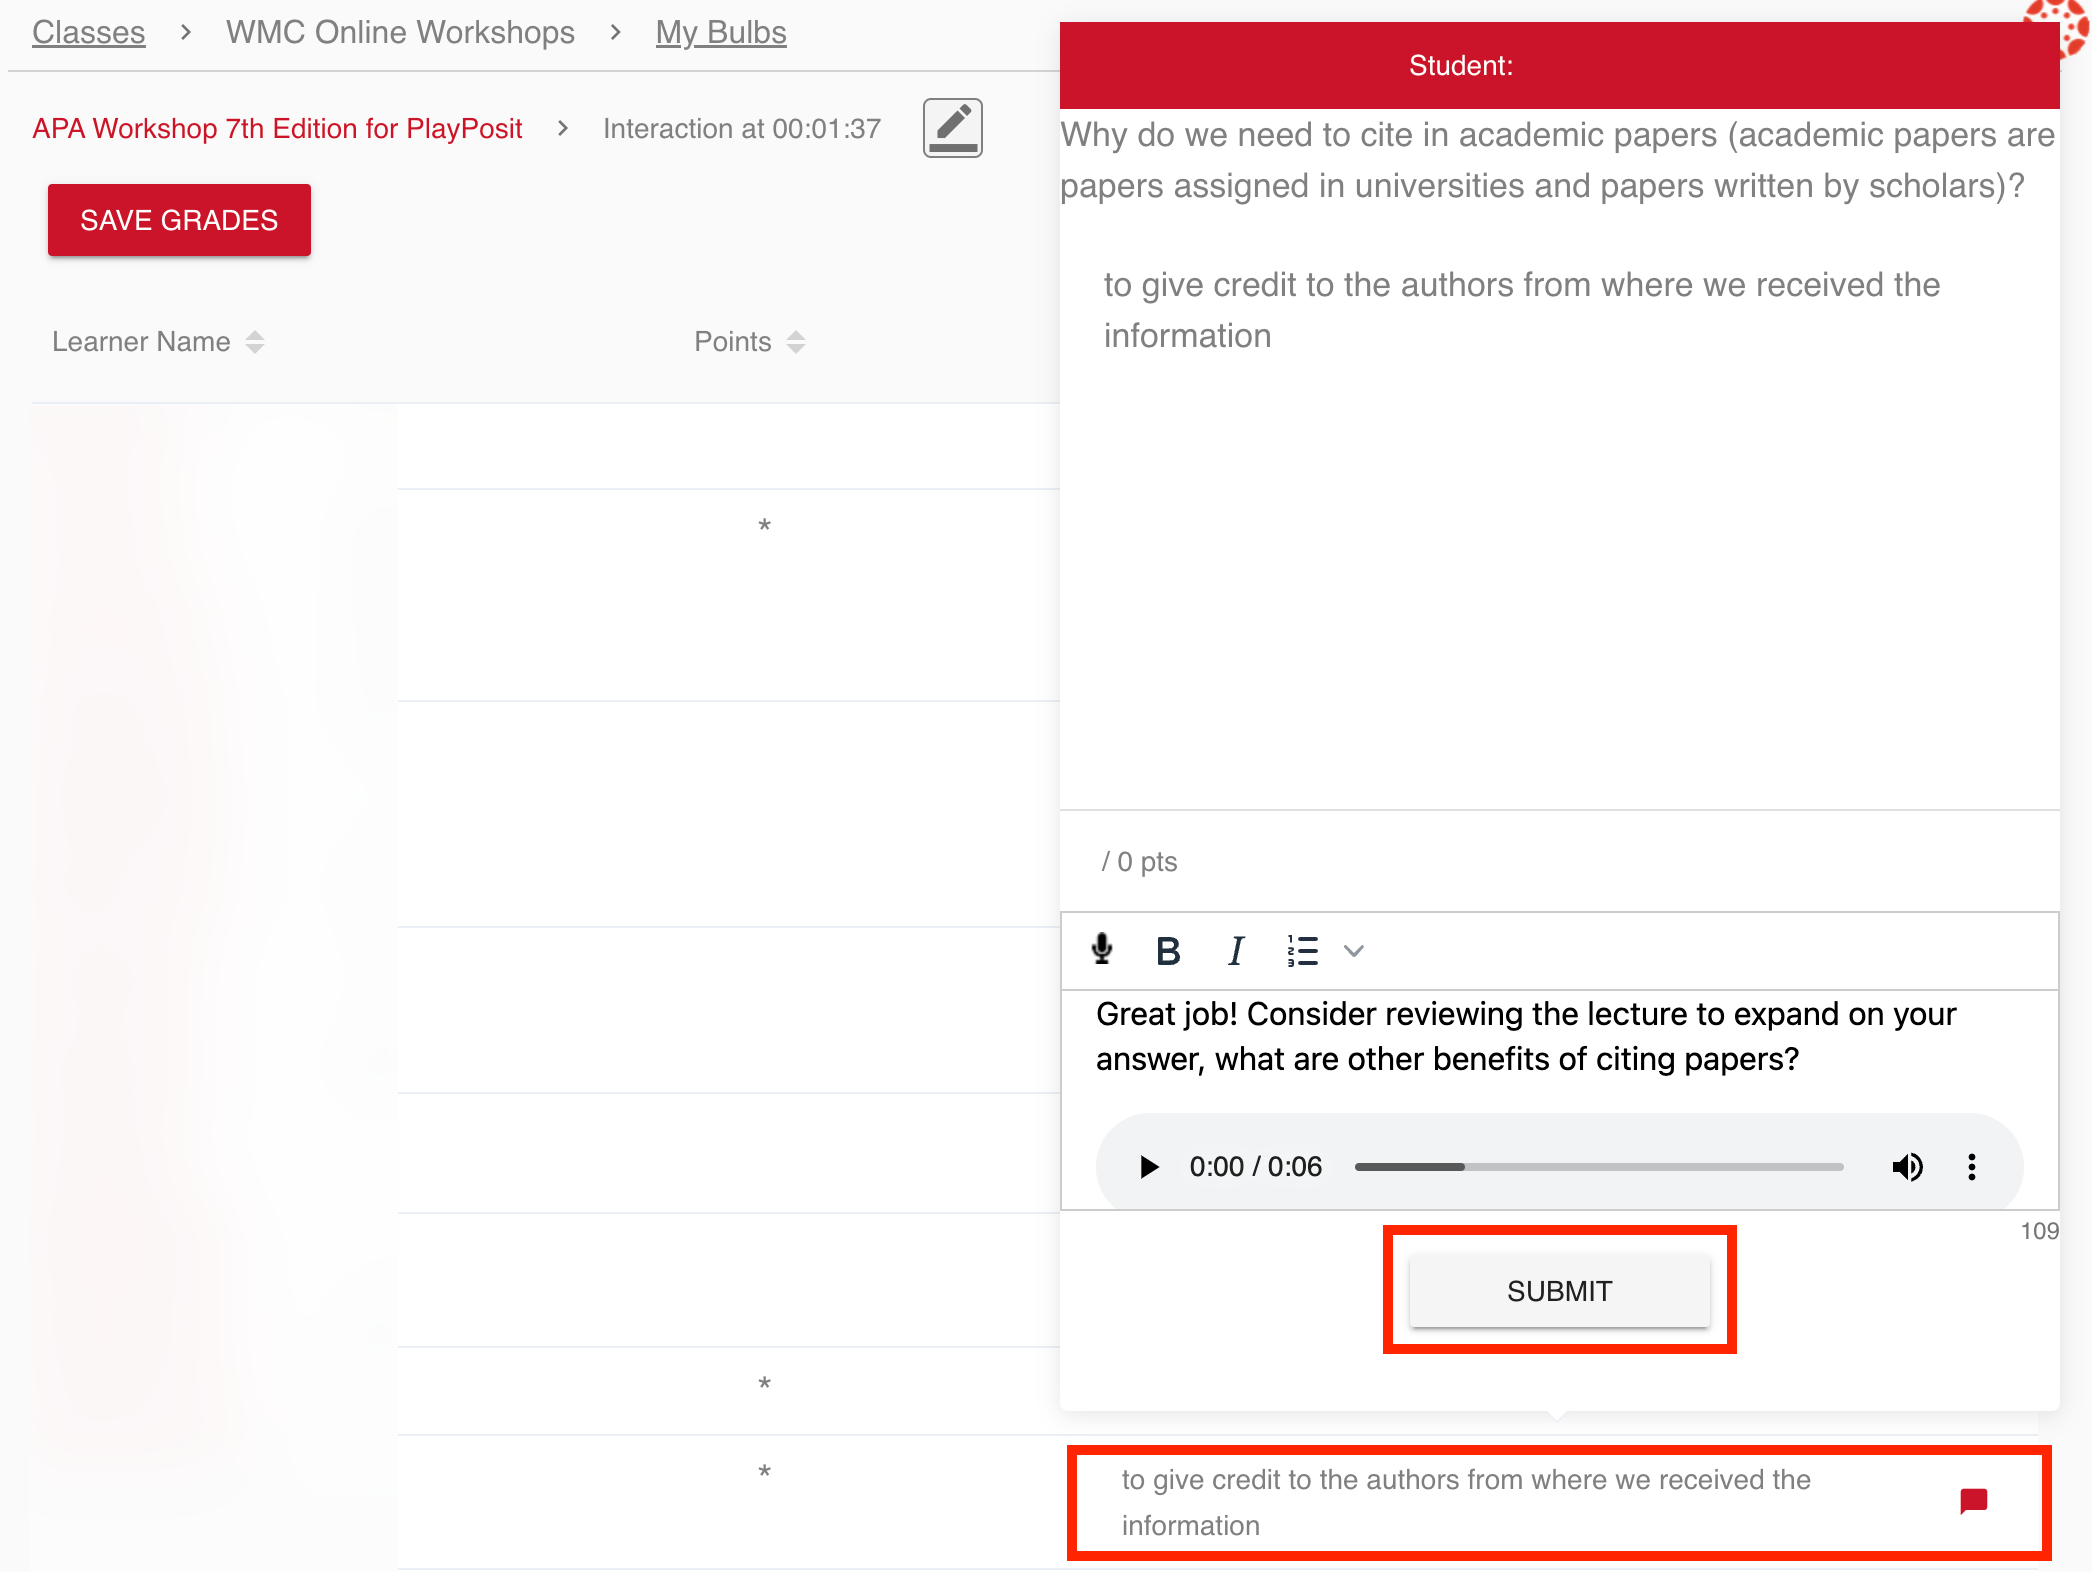
In the Grade All menu, you can quickly grade all responses to a single question. For free-response and discussion interactions, you can also leave feedback to individual students here.
Leaving Feedback
- Click on an individual student’s response.
- Use the rich text editor to leave feedback. Note that you also have the option to record an audio comment.
- Once you are happy with the feedback, click Submit.
4. Interaction Data
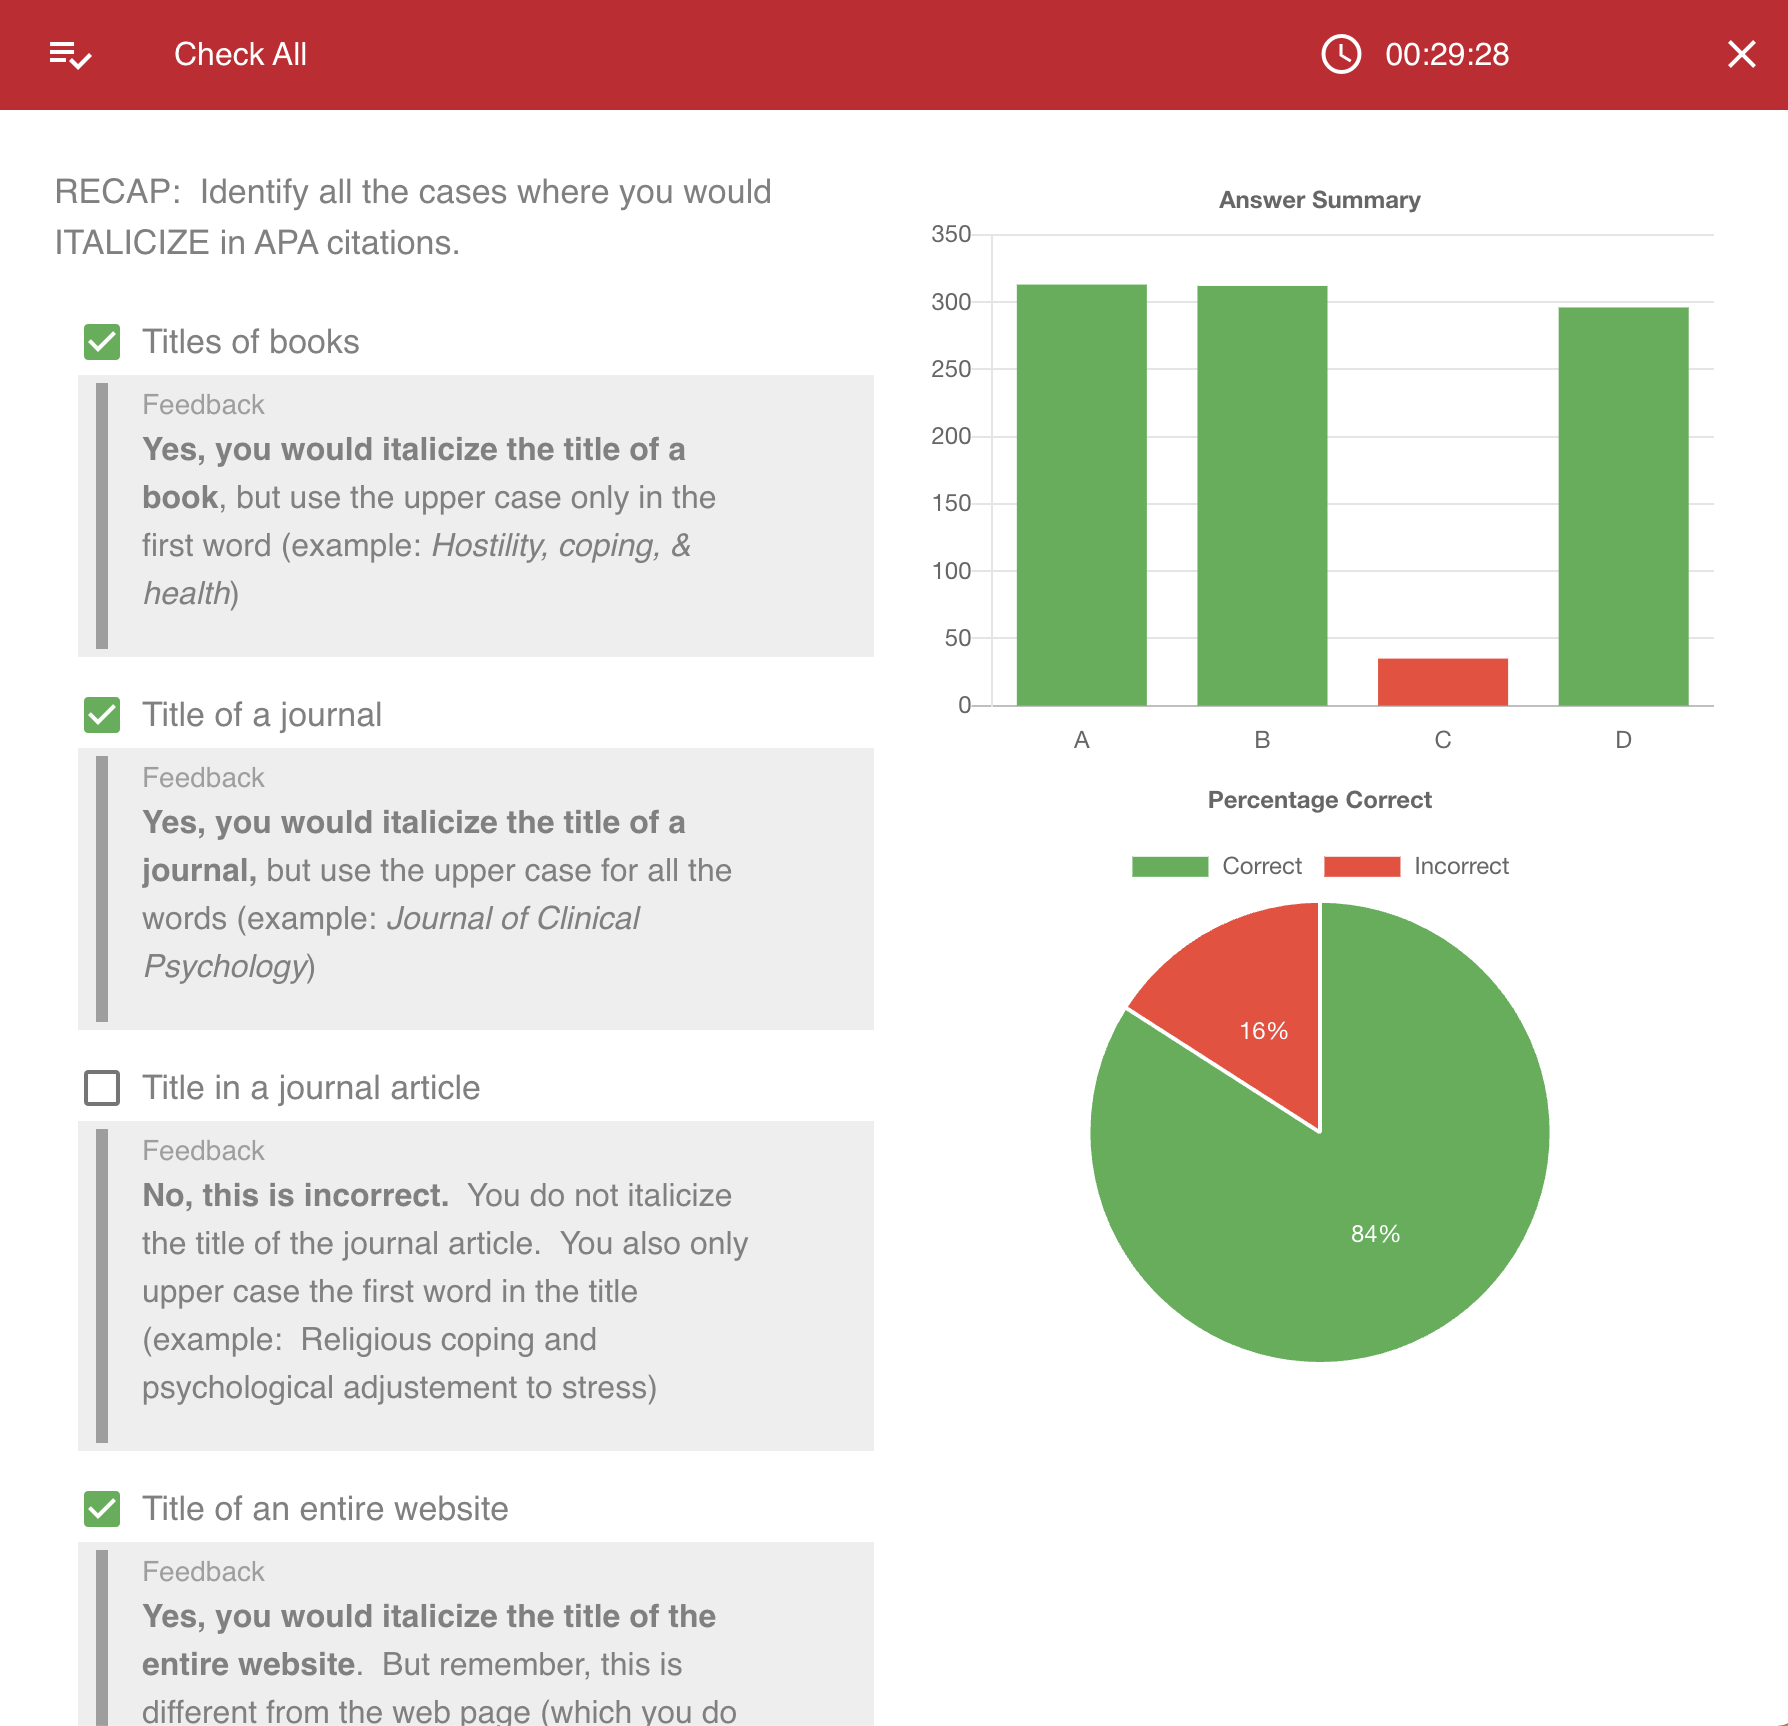
Here you can access detailed analytics on a single interaction, view the fraction of students that selected correct and incorrect responses, as well as view which individual answers were selected. This is helpful for easily assessing common misconceptions about a question.